Tables is one of the tools you can use to display information in PowerPoint. There are several ways how to make a table in powerpoint. Let's look at each of them. And you yourself choose which one will be more convenient for you to use in order to insert table into PowerPoint presentation .
How to make a table in the fastest way
- On the " INSERT» click the command « Table ».
How to Make a Table in PowerPoint - Table
- Hover your mouse over the grid of squares to select the number of columns and rows you want in the table. In our example, we will insert a 4x5 table.

How to Make a Table in PowerPoint - Inserting a Table
- The table appears on the currently selected slide.

How to Make a Table in PowerPoint - Insert a Table into a Presentation on a Slide
- Click anywhere in the table and start typing to add text. You can also use the Tab key or the arrow keys on your keyboard to navigate through the table.

How to Make a Table in PowerPoint - Entering Data into a Table
How to insert a table in a placeholder
- You can also insert a table by clicking the command " Insert table " in the placeholder.

How to Make a Table in PowerPoint - Inserting a Table in a Placeholder
- In the window that appears, enter the desired number of rows and columns. Click OK.

How to Make a Table in PowerPoint - Insert Table Dialog Box
The table with the specified parameters will be inserted into the areas.
Open the dialog box " Insert table"You can do it in another way. To do this, go to the " INSERT", click the command " Table" And in the window that opens, select “ Insert table ».

How to Make a Table in PowerPoint - Insert Table
How to make an Excel table in a presentation
If you need insert table fromExcel in PowerPoint, then for this:
- Select the desired range in the Excel workbook and copy it, for example, by pressing the keyboard shortcut Ctrl+C.

How to Make a Table in PowerPoint - Selecting a Table in Excel
- Go to the desired presentation slide and press the keyboard shortcut Ctrl+V. A table will appear on the current slide in the presentation.

How to Make a Table in PowerPoint - Insert Table from Excel
If you do not have a ready-made table in Excel, and you want to make a table in PowerPoint and then fill it out, then do the following:
- On the already familiar tab “ INSERT", click " Table " and select " Excel table ».

How to Make a Table in PowerPoint - Excel Table
- After this, a built-in Excel spreadsheet editor window will appear on the slide. Its size can be changed. Once all the information has been entered, click outside the window to close the window.

How to make a table in PowerPoint - Table editor window
Now you know how to make a table in a powerpoint presentation in several ways.
Do you have a ready-made table in Microsoft document Word or Excel? Do you want to transfer it to a Powerpoint file, but don't know how? Our article will help you solve this problem. The process of transferring a finished table from various documents office programs reliable and does not take much time. The main thing is to strictly follow all the points that we will talk about in our article.
How can you avoid wasting time creating a new table and transfer the already prepared one to a Powerpoint document?
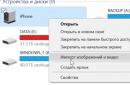
First of all, we will tell you how to copy a finished table from a Word document into your presentation. To avoid any problems with formatting, strictly follow the algorithm of actions that we offer. To begin, open both documents. Expand the file with the table, and then move the cursor over it. A square icon will be displayed in its left corner. Using it you can select the desired table. After this, you will need to click on the “Layout” tab on the top panel of the program. It will appear only after selecting a table in the “Working with Tables” group. There you will see a select button.
Click on the arrow next to this button. After clicking, a drop-down menu will appear where you will need to select the “Select table” item. Once the table is highlighted, click on the Home tab. There will be a category “Clipboard”. You will need to click on the copy button. After this, the table will be saved to the clipboard. Roll up Word document and open your presentation. When Powerpoint opens, select the slide you want. Click the Home tab and then the Insert button. After this action, the table will be completely transferred to the Powerpoint document, saving your time that would have been spent on creating it. In the same way, this procedure is carried out with Excel documents.
Moving individual table cells
However, sometimes it is not necessary to transfer the entire table from the files of this program, but only a group of cells. This is done in the following way. To select a group of cells, move the cursor to the upper left corner of the table and move it so that only those you need remain marked.
Still in the same “Home” tab, in the “Clipboard” group, click the “Copy” button. Minimize the Excel document and open your presentation. Select the desired slide and click on the “Insert” button on the main tab. After this, the necessary cells will be successfully moved, and your presentation can be shown at meetings and conferences. We hope that our article helped you learn how to work with tables in Powerpoint.
MS Word is a multifunctional program that has practically unlimited possibilities for working with documents. However, when it comes to the design of these same documents, their visual representation and built-in functionality may not be enough. That is why the package includes Microsoft Office There are so many programs included, each of which is focused on different tasks.
PowerPoint- a representative of the office family from Microsoft, an advanced software solution focused on creating and editing presentations. Speaking of the latter, sometimes it may be necessary to add a table to a presentation in order to clearly show certain data. We have already written about how to make a table in Word (the link to the material is provided below), in the same article we will tell you how to insert a table from MS Word into a PowerPoint presentation.
In fact, insert a table created in text editor Word, the PowerPoint presentation creation program is quite simple. Perhaps many users already know about this or at least guess. And yet, detailed instructions It certainly won't be too much.
1. Click on the table to activate the mode for working with it.

2. In the main tab that appears on the control panel “Working with tables” go to tab "Layout" and in the group "Table" expand button menu “Select” by clicking on the triangle-shaped button located below it.

3. Select an item “Select table”.

4. Return to the tab “Home”, in the group “Clipboard” click on the button "Copy".

5. Go to your PowerPoint presentation and select the slide to which you want to add a table.

6. On the left side of the tab “Home” click on the button "Insert".

7. The table will be added to the presentation.

- Advice: If necessary, you can easily resize the table inserted into PowerPoint. This is done in exactly the same way as in MS Word - just pull one of the circles on its outer border.

That's all, in fact, from this article you learned how to copy a table from Word to a PowerPoint presentation. We wish you success in your further development of Microsoft Office programs.
Not every presentation can do without a table. Especially if it is an informational demonstration that shows various statistics or indicators in certain industries. PowerPoint supports several ways to create these elements.
The simplest format for creating a table in a new slide.


The method is quite simple and universal. Another problem is that after manipulating the text area, the icons may disappear and never return. It should also be noted that this approach removes the area for the text, and you will have to create it in other ways.

Method 2: Visual creation
There is a simplified way to create tables, which means that the user will make small tables with a maximum size of 10 by 8.

This option is extremely simple and good, but is only suitable for creating small table arrays.
Method 3: Classic method
A classic method that has been carried over from one version of PowerPoint to another over the years.

The best option if you need to create a regular table of any size. The objects of the slide itself do not suffer from this.
Method 4: Paste from Excel
If you have an already created table in Microsoft Excel, then you can also transfer it to a presentation slide.

Also, nothing prevents you from inserting a table using the Microsoft Excel editor.
The old path – tab "Insert", then "Table". Here you will need the last point - "Excel Table".

After selecting this option, a standard Excel 2 by 2 matrix will be added. It can be expanded, resized, and so on. When the processes of editing dimensions and internal format are completed, the Excel editor will close and the object will take on the appearance specified by the formatting of the style of this presentation. Only text, size and other functions will remain. This method is useful for those who are more accustomed to creating tables in Excel.

It is important to note that with the latter method, the system may throw an error if the user tries to create such a table while Excel application. If this happens, you just need to close the program that is interfering and try again.
Method 5: Manual creation
It’s not always possible to get by with just standard creation tools. Complex types of tables may also be required. You can only draw these yourself.


This method is quite complicated, since it is not always possible to quickly draw the necessary table. However, with the right level of skill and experience, manual creation allows you to create absolutely any types and formats.
Table builder
Basically a hidden header tab that appears when you select a table of any type - be it standard or manual.
The following important areas and elements can be highlighted here.

- "Table Style Options" allow you to mark specific sections, for example, a summary line, headings, and so on. This also allows you to assign a unique visual style to specific departments.
- "Table styles" have two sections. The first offers a choice of several basic designs for these elements. The choice here is quite large, you rarely have to invent something new.
- The second part is the manual formatting area, which allows you to independently configure additional external effects, as well as color shading for cells.
- "WordArt Styles" allow you to add special inscriptions in image format with a unique design and appearance. It is almost never used in professional tables.
- "Draw boundaries"- a separate editor that allows you to manually add new cells, expand borders, and so on.
Layout
All of the above provides wide functionality for customization appearance. As for the content specifically, here you need to go to the next tab - "Layout".


As a result, using all these functions, the user is able to create a table of absolutely any degree of complexity for a variety of purposes.
- It's worth knowing that it's not recommended to use animations on tables in PowerPoint. This can distort them and also simply not look very nice. An exception can be made only when using simple input, output or highlight effects.
- It is also not recommended to create bulky tables with a huge amount of data. Of course, except when necessary. It must be remembered that in most cases, a presentation is not a carrier of information, but is only intended to demonstrate something over the speaker’s speech.
- As in other cases, basic design rules also apply here. There should be no “rainbow” in the design - the colors of different cells, rows and columns should be perfectly combined with each other, not hurt the eyes. It is best to use preset design styles.
To summarize, it is worth saying that Microsoft Office always has a complete arsenal various functions for anything. The same goes for tables in PowerPoint. Although in most cases standard types with adjustable row and column widths are sufficient, you often have to resort to creating complex objects. And here you can do it without unnecessary problems.
Any presentation looks more impressive and clearer if it contains elements such as tables and diagrams. But PowerPoint's built-in tools don't have the same capabilities or are as convenient as Excel's equivalent tools. Therefore, it is important to be able to insert tables and charts created in Excel into slides.
This can be done using embedding or linking.
First of all, you need to understand the difference between “linking” and “embedding”.
If we do not need (and sometimes it is not desirable) to update a table or chart obtained from Excel in a presentation, then we use embedding. In this case, a static copy of the data is placed on the slide, i.e. the embedded object becomes part of the presentation and is no longer associated with the data source. The size of the presentation file naturally increases.
If we need to keep data obtained from Excel up to date, we should use binding. In this case, a link to an Excel object is placed on the slide; accordingly, if the source table or chart is changed, the data on the slide will also change.
Let's consider different ways linking and implementation.
1. VIA CLIPBOARD
We all know that working with the clipboard is done using commands Copy/Paste. But it should be noted that in presentations the command action Insert differs for tables and charts.
If you have selected a table in an Excel file, run the command Copy, went to the slide and gave the command Insert, then the table will be inserted as a PowerPoint table with the ability to edit using PowerPoint, but by default there will be no connection to the source. That is, it will happen implementation .
If you perform the same actions with the diagram, the diagram will be inserted as a PowerPoint diagram with the ability to edit using PowerPoint, and by default a connection will be established with the source. That is, it will happen tying .
If we want to change the default paste options, we will have to useSpecial insert. To do this in select a range of cells or a chart on an Excel sheet and execute the command Copy, go to the slide and give the command Special insert. The placement of this command varies depending on the version of PowerPoint.
In versions up to and including PowerPoint 2003, it is located in the menu Edit. Beginning with PowerPoint 2007, this command can be found in the button drop-down list Insert on the tab Home.
Dialog box Special insert looks like this:
if a table is inserted
if a diagram is inserted
In both cases, you can select a radio button in this dialog box Insert/Link, and also select the format of the inserted object.
Additionally, as of PowerPoint 2010, context menu team present Paste Options, which allows you to select embedding or linking options.
When inserting tables, only embedding options are available

And when inserting diagrams - both embedding and linking
2. CREATION OF A NEW OBJECT
To create a table or chart on a slide using Excel, on the tab Insert in the group Text press the button Object,

for versions older than PowerPoint 2007, execute the menu commandInsert -- Object

and in the dialog box that openslooking for a line in the listMicrosoft Excel Sheet and press OK

After this, on the document page we see a fragment of an Excel sheet, as well as a ribbon with Excel tabs (or menus).
The same result will be obtained if on the tab Insert expand the list under the button Table and select an option Excel table.

Thus, we can embed an Excel table and work with it, using all the capabilities of this program, right on the slide.
If we want to create an embedded diagram, then in the dialog box Inserting an object on the tab Creationselect a lineMicrosoft Excel chart.In this case, more than one will be created Excel sheet, and two: the first will contain an example of a diagram, and the second will contain the original data for it, which should be replaced with your original data.


Once the table/chart has been created, clicking outside the object frame takes us back to the document. If you want to return to editing an object, just double-click on it.
3. CREATING AN OBJECT FROM A FILE
To do this, on the tabInsert in the group Text press the button Objectand in the dialog box that opens, set the switchCreate from file. Using a buttonReviewfind the one you need in Explorer Excel file. In this case, pay attention to the checkbox Link. If it is not installed, then implementation tables or diagrams on the slide, but if you check the box, it will tying . Click OK.

The sheet that was active the last time the workbook was saved is inserted into the slide.
Perhaps it’s worth taking a little closer look at the differences in “behavior” between embedded and linked tables and charts created from a file.
If the object is embedded, i.e. connection with the source is not established, then double-clicking on the object will lead to a transition to editing mode. In this case, the PowerPoint ribbon (menu) will be replaced by the Excel ribbon (menu) with all the tools, but we will see the embedded object itself on the slide in a characteristic dashed frame.

If the table or chart is linked to a source, then double-clicking for editing will open the source file in a separate Excel window.

After changes are made to the source file, we save it, and then these changes are reflected on the slide in the associated table or chart.
Initially, PowerPoint resizes the inserted table or chart so that it fits completely on the slide. Because of this, large tables can be so small that they become unreadable. If we want, for example, to display part of a table on a slide, then we should learn how to change the size of the displayed object. The dimensions of the embedded object are controlled using dimensional handles at the corners and at the midpoints of the sides of the selection frame. In addition, the same dimension markers are available if you enter the editing mode of the embedded object.
What's the difference? If you move dimension markers while in edit mode implemented object, then you increase/decrease the number of visible rows/columns.
Was

It became

If you do the same operation without entering editing mode, then you simply stretch/compress the drawing.
Was

It became

Advice. If you plan to embed a diagram in a document, it is better to place it on a separate sheet.

When you open a file with linked tables or charts, a dialog box appears asking you to update the links.

If you are unsure about the reliability of the source of the linked files, click Cancel.
If option is selected Update connections, the data in the presentation will be updated according to the latest changes in the Excel workbook.
To established connection worked, it is required that the spreadsheet file is not renamed or moved. If this happens, you can use the dialog box to re-register the path to the sourceConnections.

As you can see, in this dialog box there is an optionChange source, and also Break connection, if it is no longer required. In addition, here you can choose how to update the connection:automatically or manually.
In versions prior to PowerPoint 2007, this dialog box opens when you execute a menu command Edit - Connections.

In PowerPoint 2007, you can open it by clicking the Office Button and choosing Prepare -- Change links to files.

Starting with PowerPoint 2010, select the tab to do this File -- Details -- Linked Documents -- Edit File Links.

EXAMPLES